Historical map · 1000
Map of North America in 1000
In 1000, the historical border data behind our interactive map draws 5 states, empires and other polities in North America. By the land they held inside this region, the largest were the Later Mayan City-States, Puebloans - Chaco Regional System and Classic Veracruz Culture.
See this map live. The interactive map opens on North America in 1000. Zoom in, move the year slider to watch the borders change, or ask the history guide a question and it draws the answer on the map.
OPEN 1000 ON THE MAP →Ask the history guide about 1000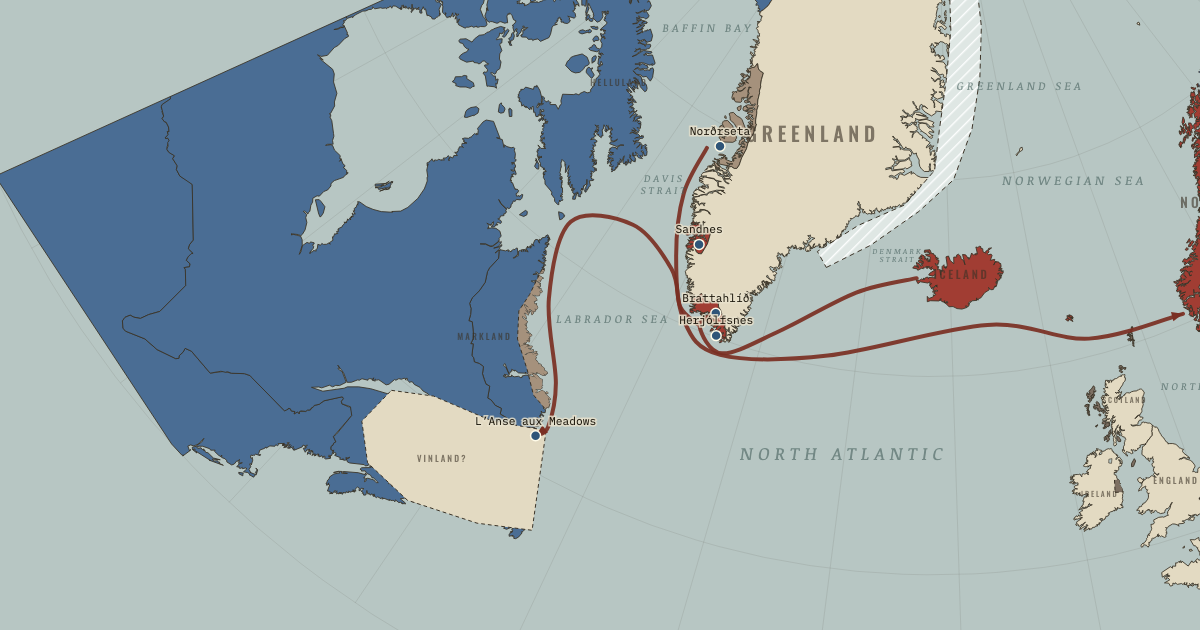
States and empires in North America in 1000
| State | In this region | In the data |
|---|---|---|
| Later Mayan City-States Wikipedia | 136,000 km² | 247 BC–AD 1546 |
| Puebloans - Chaco Regional System Wikipedia | 21,000 km² | 850–1304 |
| Classic Veracruz Culture Wikipedia | 19,000 km² | 555–1235 |
| Viking settlements Wikipedia | 16,000 km² | 793–1332 |
| Toltec Wikipedia | 5,620 km² | 875–1187 |
"In the data" gives the first and last year the dataset draws the state under this identity; states often existed earlier or later in another form.
What changed since 900
New on the map: Viking settlements.
What comes next: 1100
Appear by 1100: Norse Greenland.
Read the history of 1000
Guided atlas chapters set near this date, each with its own map, causes and consequences:
- Greenland and VinlandClimate and Innovation · chapter 4 · 1021
Questions about this map
Which countries were in North America in 1000?
The map data draws 5 states and other polities in North America in 1000. The largest by land were the Later Mayan City-States, Puebloans - Chaco Regional System, Classic Veracruz Culture, Viking settlements and Toltec.
What was the largest empire in North America in 1000?
Of the states on this map, the Later Mayan City-States held the most land in total: about 136,000 km² in the reconstruction used here. Ancient and frontier borders are approximate, so treat areas as estimates.
Can I explore North America in 1000 interactively?
Yes. Open the interactive map at 1000, zoom into any region, move through the years, and ask the history guide questions: it answers in plain words and draws places, armies and borders on the map.
About these borders
The borders come from Cliopatria (v0.2.1, Seshat Global History Databank, CC BY 4.0), the dataset behind our interactive map, with our audited name and border corrections. It records each state's territory year by year from 3400 BC to 2024. Borders before modern surveys are reconstructions: the data draws a state where it held control, and frontier zones, nomadic realms and loose overlordships are approximate. Areas are measured on an equal-area projection. Read how we make our maps.
North America in other years
- 600
- 700
- 900
- 1000
- 1100
- 1200
- 1300
- 1400
- 1453
- 1492
- 1500
- 1550
- 1600
- 1648
- 1700
- 1750
- 1776
- 1789
- 1800
- 1815
- 1830
- 1850
- 1871
- 1880
- 1900
- 1910
- 1914
- 1918
- 1920
- 1930
- 1938
- 1939
- 1940
- 1942
- 1945
- 1950
- 1960
- 1970
- 1980
- 1990
- 2000
- 2010
- 2020